Los Angeles Unified School District (LAUSD)
To help spread the CSN network throughout the Los Angeles region, we are conducting a project to deploy the sensors in schools. To this end, we are carrying out a pilot project with the largest school district in the region—the Los Angeles Unified School District (LAUSD). This is also the second largest school district in the U.S. with over 500,000 students and approximately 1000 campuses spanning all levels of education below college.
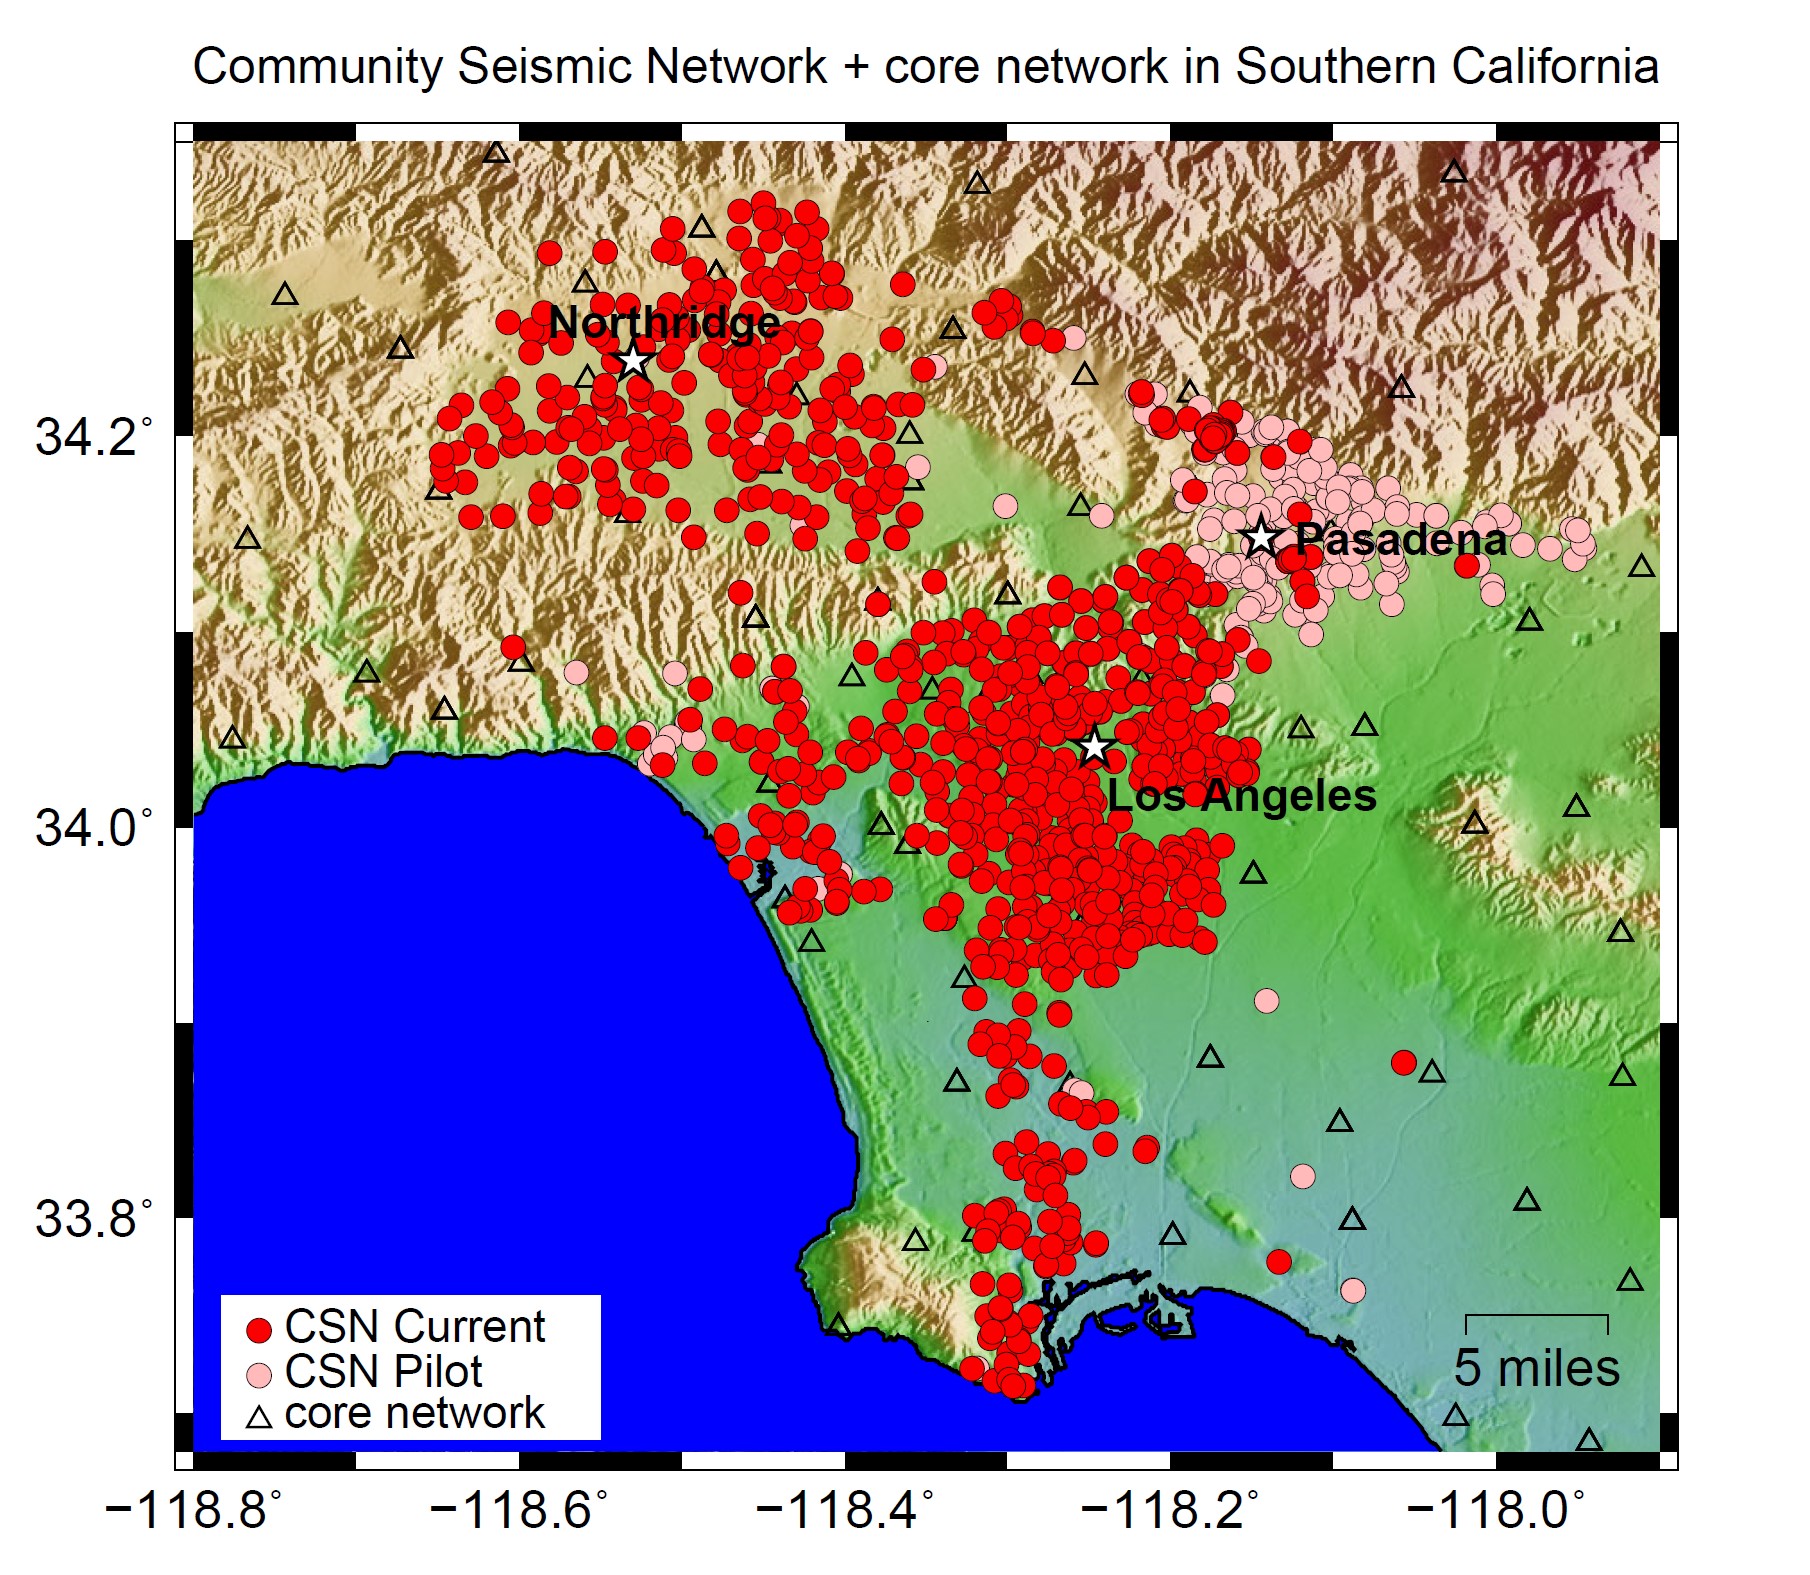
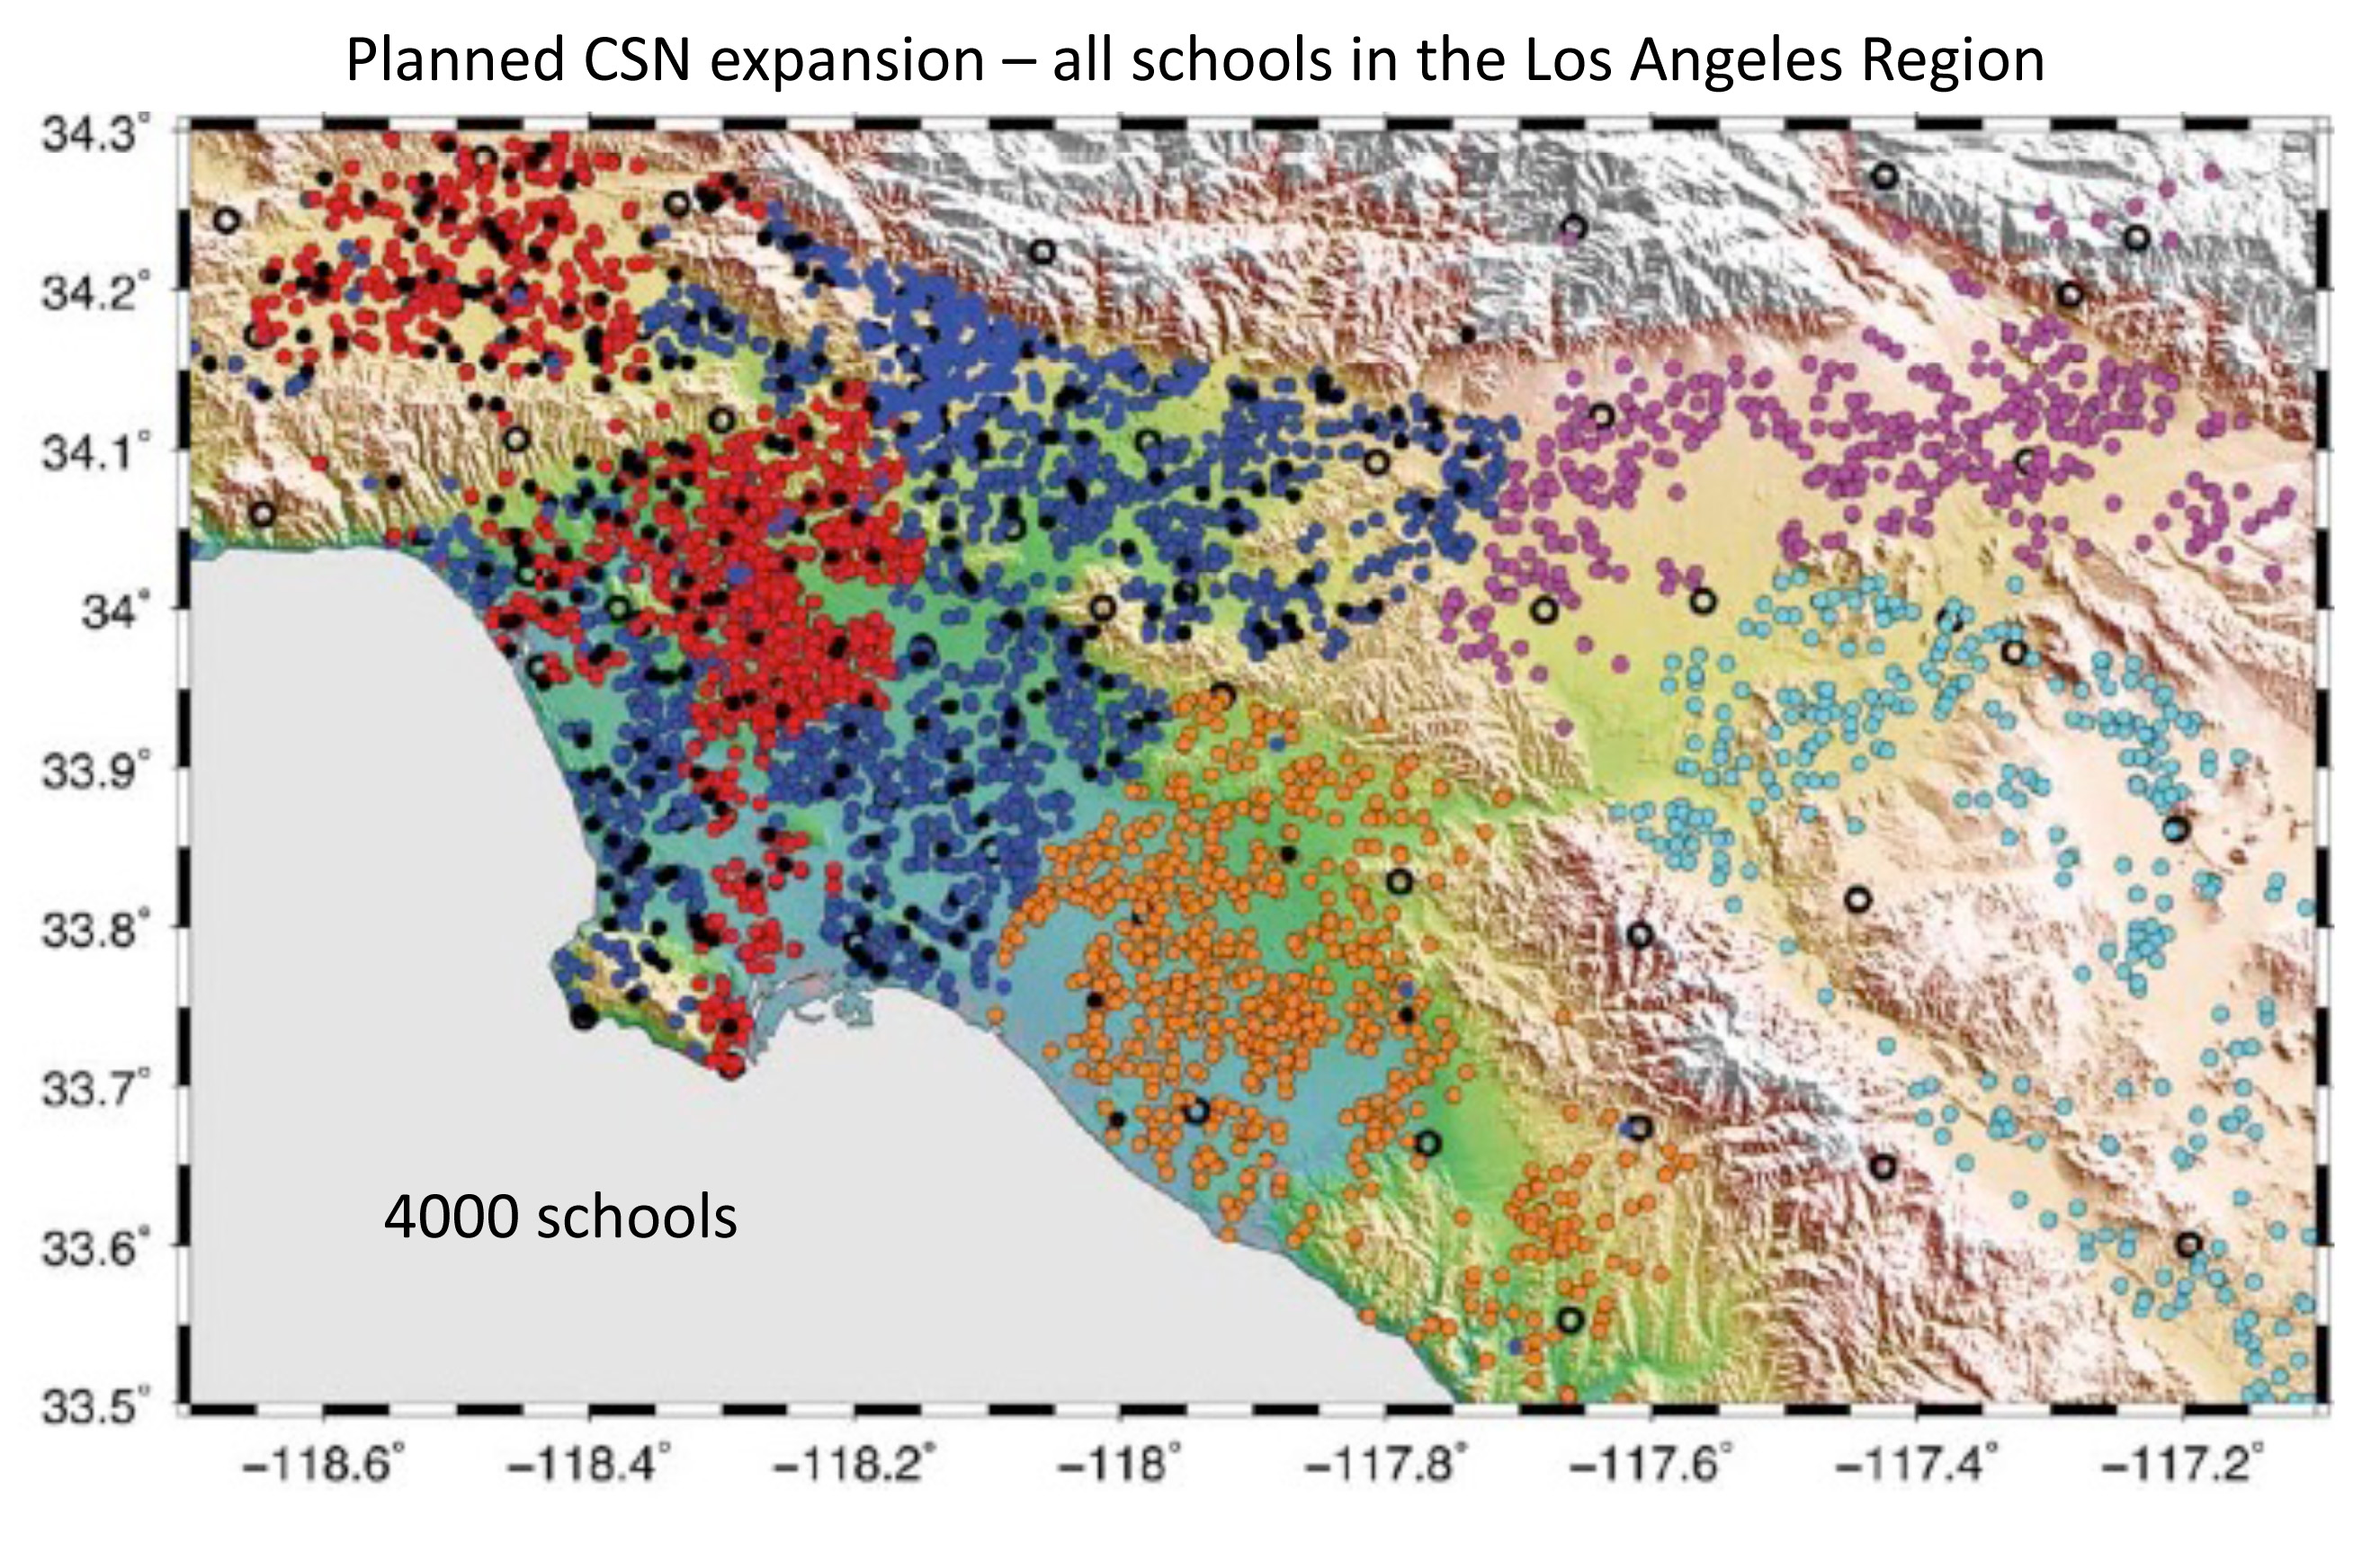
The initial project consisted of 100 schools, and this has now been augmented to almost 1000 campuses with funding from the Conrad N. Hilton Foundation and Computer & Structures, Inc. The long-term plan is to start a similar process with other public and private schools in the region. We estimate that there are around 4000 campuses in total.
The school deployments are done as part of the emergency response of the school districts and are not directly connected to the educational program of the school. A lesson we learned with the Pasadena and San Marino schools is that instruments deployed as part of an educational plan tend to disappear after the lesson on earthquakes is over. In the current deployment, the instruments are placed near where the Internet enters the campus, usually in the basement or on the first floor. Teachers, if they desire, can get access to the real-time output of the instruments.
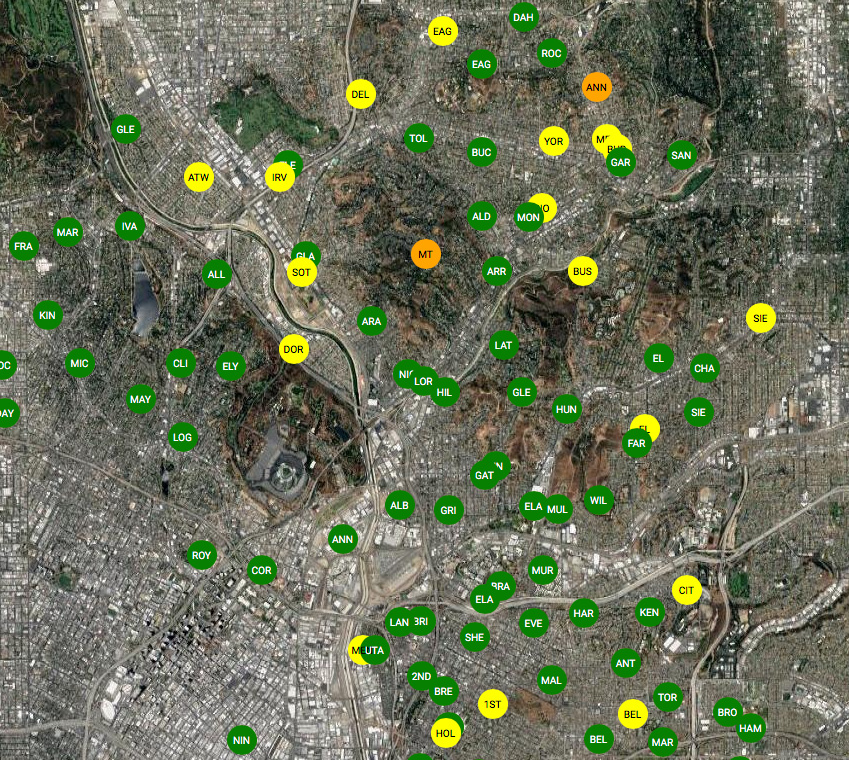
Monitoring the peak acceleration at each campus provides a synoptic view of the entire LAUSD system and hence can be used by emergency responders to make decisions and plan their response. The peak shaking map can be viewed from anywhere. In the figure below, we show a simulation of this product. Here the green circles indicate that the building is likely not damaged, yellow circles denote possible damage and orange circles show buildings that have exceeded their design capacity and are likely damaged.
The schools serve an important role beyond their educational function. They are often the location for emergency evacuations for many types of disasters, and earthquakes in particular. It is important to be able to assess the state of health of this resource immediately following an earthquake.
The following is a pair of plots of acceleration observations at a school campus.
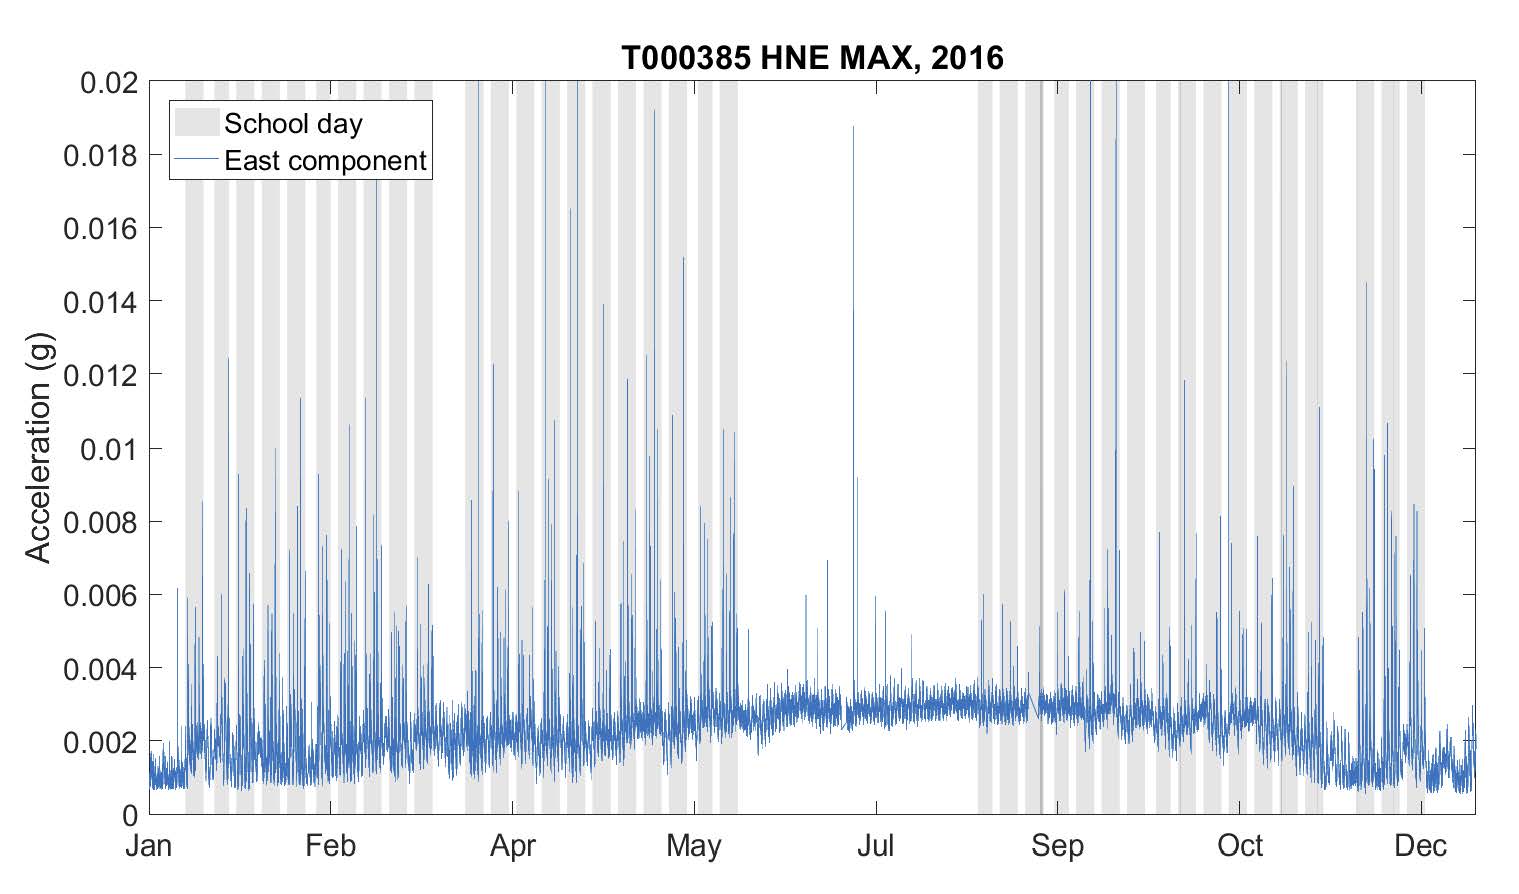
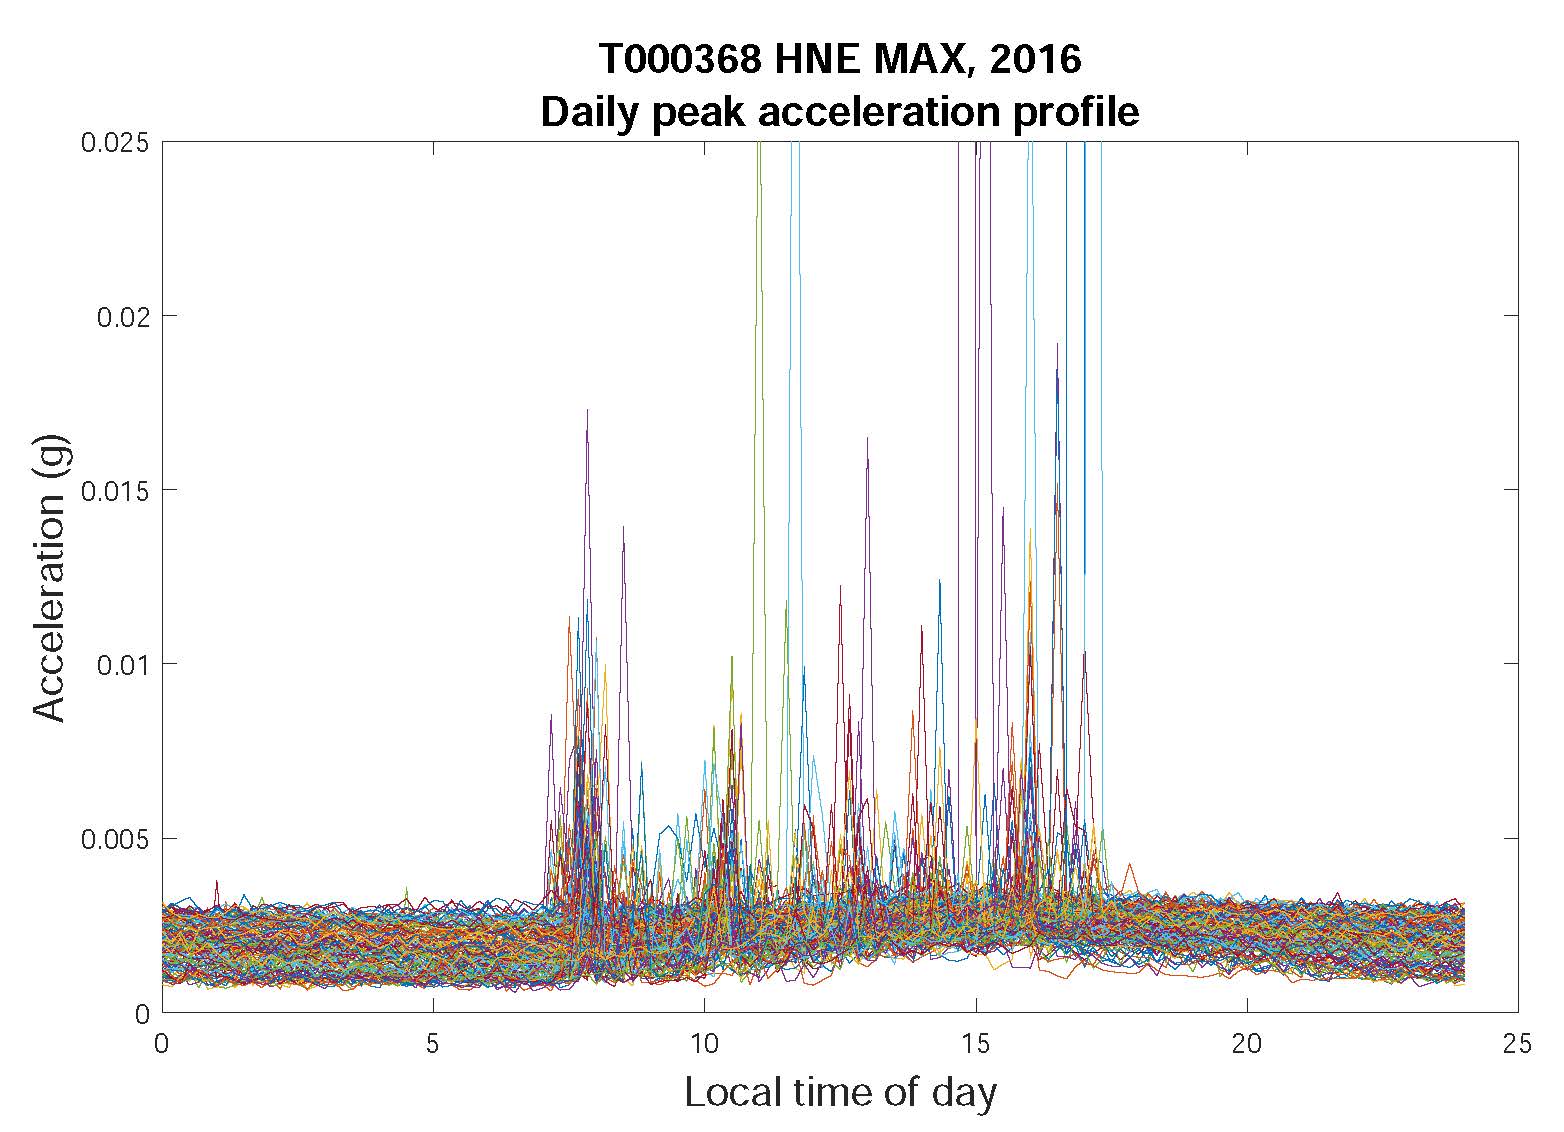
Variations at a School: The left plot shows the maximum acceleration each day for a year at one of the school campuses. The right plot shows the daily variation in accelerations at the school—each color is a different day.